
Air quality, street by street.
Kaatru is an open air quality monitoring platform for India. Volunteers install low-cost sensors on balconies, rooftops, and school buildings, and the readings get published for anyone to check or build on.
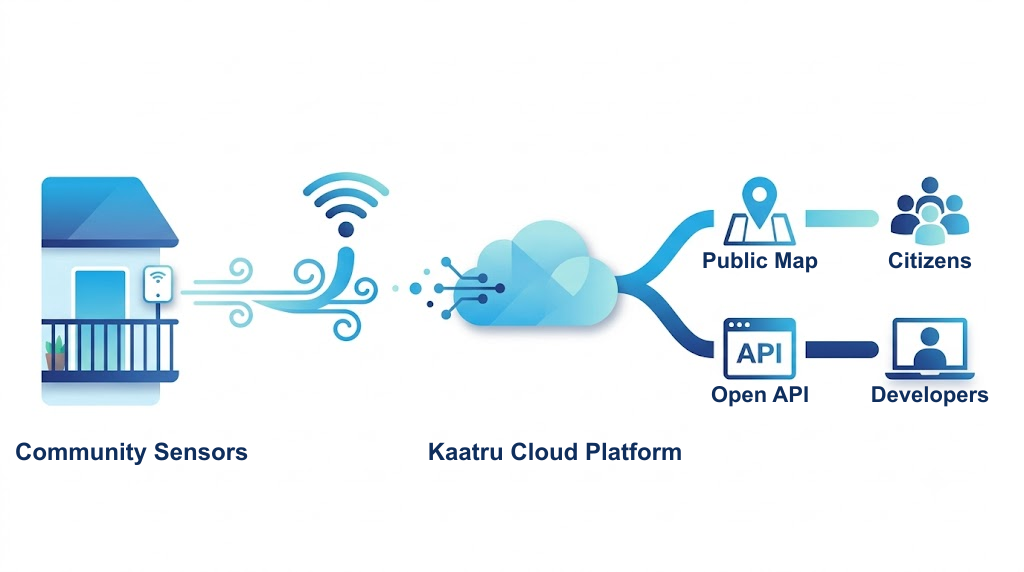
Street-level air quality, where government stations can’t reach.
Government reference stations are accurate, but there are very few of them. Kaatru adds a dense layer of low-cost, community-hosted sensors alongside them, so pollution can be tracked block by block instead of city by city.
- A denser layer of sensors alongside existing government stations
- Visibility down to individual streets and neighbourhoods
- Pollution differences between streets, apartments, schools, and industrial zones, made visible
- Built from affordable components, so many more sensors can be deployed
Here’s what a single city-wide number can’t do.
Air pollution isn’t uniform. It can vary five to ten times within a few hundred metres, so one reading for an entire city misses almost everything that actually matters.
Decisions that need your street, not your city.
A city-wide number can't answer questions scoped to your exact location: is it safe for your kid's school to have outdoor PE today, or which street to walk to avoid the worst of it.
Source attribution, not just awareness.
A city AQI tells you the city is moderately polluted, but not where or from what. Dense block-by-block data can show that one specific street is consistently three times worse than the one next to it, the difference between a vague statistic and something a local authority or community can actually act on.
Catching short, local, acute events a city average smooths away.
A construction site kicking up dust for two hours, trucks idling outside a school gate, local burning. A daily or hourly city average erases these. If you're standing there, you're breathing that moment, not the city's 24-hour average.
Making inequality visible.
Poorer neighbourhoods near highways, industrial zones, or waste sites often have measurably worse air than wealthier parts of the same city. A single city number erases that disparity entirely. Hyperlocal data turns it into evidence.
“Life itself is air (Kaatru).”
Better air quality for everyone.
You can’t fix what you can’t measure. Kaatru starts there: a public map of nearby air quality, an open API for developers, and historical records that let researchers and local authorities trace pollution to its source and act on it.
Low-cost sensors
Built from affordable, widely available components.
IoT connectivity
Sensors connect over WiFi and send readings continuously.
Cloud data platform
Every reading is stored and exposed through an open API.
Community participation
Citizens, apartments, schools, and organizations host nodes.
Data calibration
Readings are checked against reference stations and corrected.
Live readings and historical data are published openly.
View live AQI anywhere sensors are deployed
Install your own Kaatru sensor node
Register sensors with the network
Share air quality data publicly
Access historical air quality trends
Use APIs for applications and research
Right now, hosting a sensor matters more than writing code.
That’s Phase 1: a single sensor node being built and tested in Chennai. If you’d like to host one, help build it, or just keep an eye on progress, get in touch.
Host a sensor
Balconies, rooftops, and school campuses are good spots for the first nodes.
Support calibration
Researchers and institutions can help validate sensor accuracy against reference stations.
Write code
Firmware, backend, and frontend work is ongoing too — see open roles for what's needed.